
Introduction to Candlestick Patterns in Forex Trading
Candlestick patterns are a powerful tool in technical analysis, widely used by traders in various financial markets, particularly in forex trading. These patterns visually represent price movements over a specific time period, with each candlestick displaying four key price points: the opening, closing, high, and low. Understanding these patterns allows traders to interpret market sentiment, identify potential price reversals, and make informed decisions about entering or exiting trades.
These patterns can signal important market behaviours such as trend reversals or continuations. Traders use candlestick analysis to predict where the market might move next, which is why understanding these patterns is crucial for success in forex trading.
Basic Components of a Candlestick
Before diving into the most common candlestick patterns, it’s important to understand the basic components of a candlestick:
A single candlestick consists of a body and wicks (or shadows), which represent the price movement during a specific period. The body is the rectangular part, with the color indicating whether the market closed higher (bullish) or lower (bearish) than the opening price. The wicks show the highest and lowest prices reached during the time frame of the candlestick.
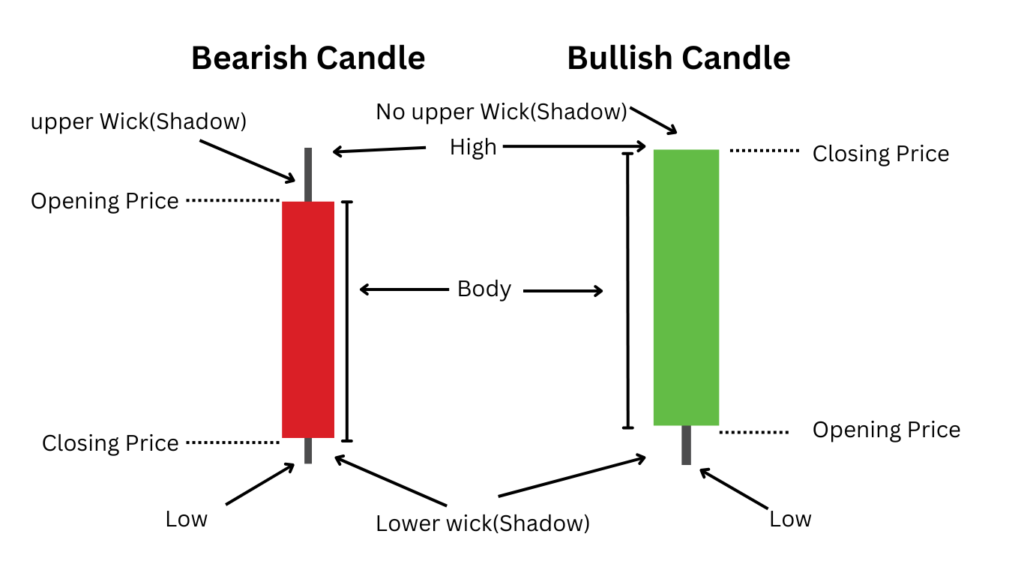
- Body: The solid part of the candlestick, representing the difference between the opening and closing prices.
- Wicks: The thin lines above and below the body, indicating the highest and lowest prices reached during the trading period.
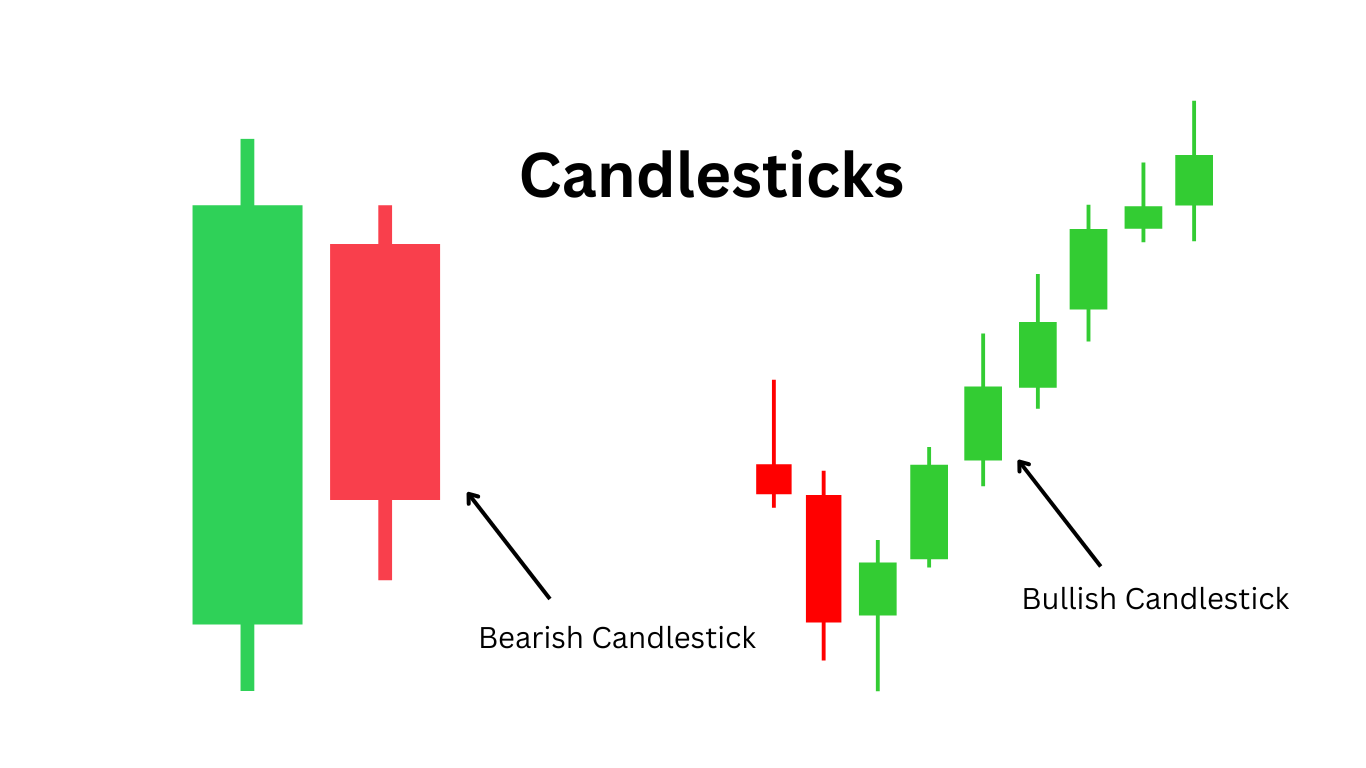
- Colour: A green or white body indicates a bullish candle (closing price higher than opening price), while a red or black body indicates a bearish candle (closing price lower than opening price).
Understanding these components helps traders interpret market conditions effectively. A single candlestick might represent a single minute, hour, or day of trading, depending on the chart timeframe being used.
Candlestick patterns can be categorized into single, double, and triple patterns, with each providing different insights into market behaviour. Some patterns signal bullish trends (potential upward movement), while others suggest bearish trends (potential downward movement). Recognizing these patterns and understanding their significance helps traders anticipate market movements and make more accurate predictions.
Importance of Candlestick Patterns in Forex Trading
Candlestick patterns are essential because they help traders spot potential reversals and trend continuations in the forex market. By observing these patterns on price charts, traders can better understand the psychology of market participants. For example, a Bullish Engulfing pattern suggests that the buyers are taking control, signaling a potential upward price movement, while a Bearish Engulfing pattern indicates that the sellers are dominating, which could lead to a downward trend.
Some well-known patterns like the Doji, Hammer, Shooting Star, and Morning Star are considered highly reliable by many traders, especially when they appear after significant trends. Using these patterns in combination with other technical indicators, such as moving averages or RSI (Relative Strength Index), increases the accuracy of trade predictions.
Why Use Candlestick Patterns?
Candlestick patterns help traders make better-informed decisions by providing clear signals of market sentiment. They are essential for both beginners and experienced traders because they offer easy-to-understand insights into market dynamics. Additionally, candlestick charts make it easier to identify key levels of support and resistance, trend reversals, and continuation signals, which are critical in developing successful trading strategies.
For beginners, learning to recognize and interpret candlestick patterns is one of the most essential steps in mastering forex trading. As traders gain experience, they can combine multiple candlestick patterns to improve the precision of their trading strategies and refine their decision-making processes.
The Most Popular Candlestick Patterns
Candlestick patterns come in different forms, and each one provides unique insights into the market. Some are indicative of potential reversals, while others suggest the continuation of a trend. Below are some of the most widely recognized and important candlestick patterns:
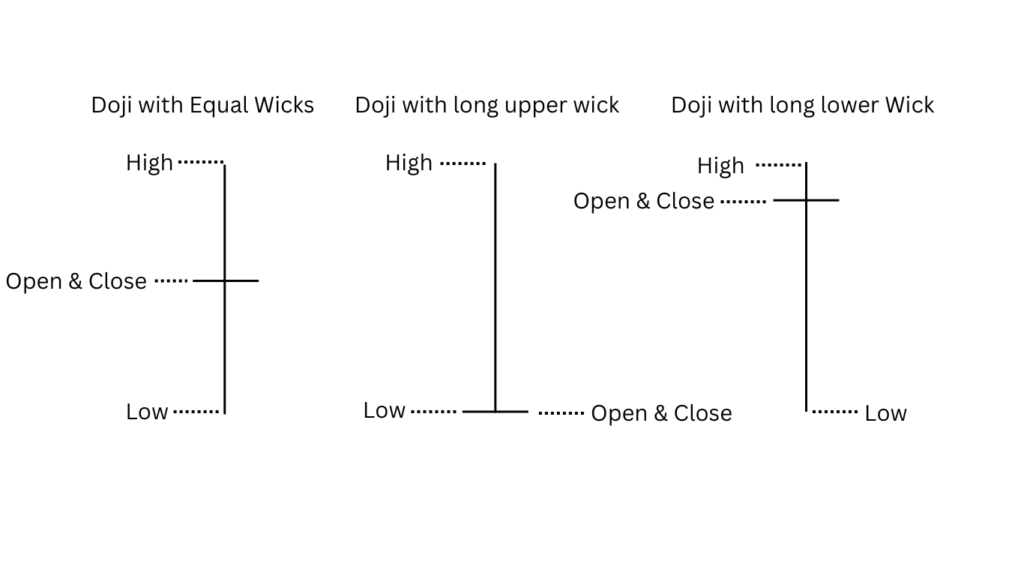
1. Doji Candlestick
A Doji occurs when the opening and closing prices are nearly the same, resulting in a no or very small body. This pattern indicates indecision in the market. The long wicks suggest that both buyers and sellers have tried to take control, but neither has succeeded. A Doji by itself doesn’t indicate direction, but when it appears after a strong trend, it can signal a potential reversal.
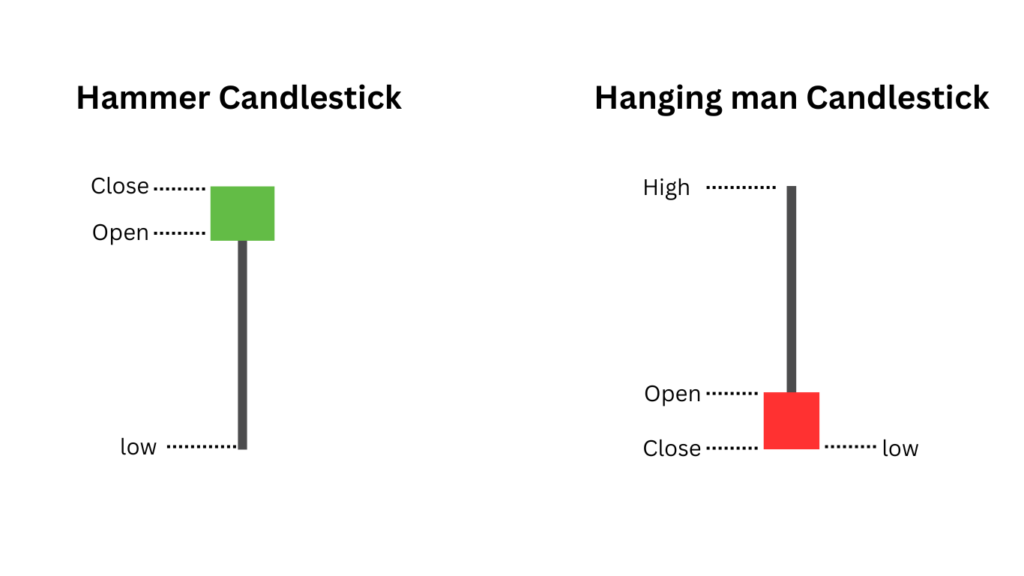
2. Hammer and Hanging Man
Both the Hammer and Hanging Man have similar appearances, with small bodies and long lower wicks. The key difference is their location within the trend. A Hammer appears at the bottom of a downtrend and suggests a bullish reversal. Conversely, a Hanging Man appears at the top of an uptrend and suggests a bearish reversal. The long wick shows that sellers tried to push the price down, but buyers pushed it back up, indicating potential trend change.
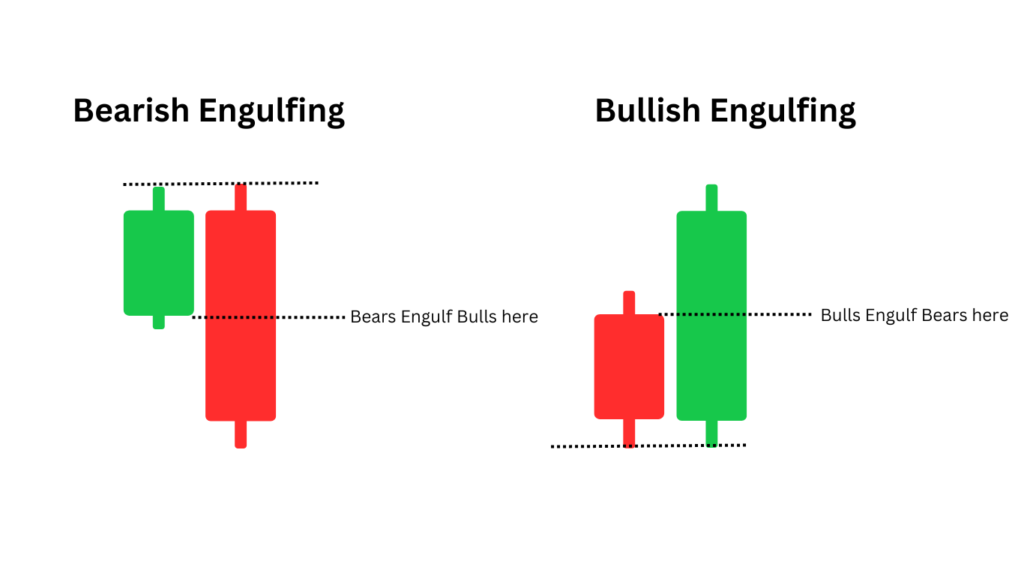
3. Engulfing Pattern
The Engulfing pattern consists of two candles. The second candle completely engulfs the first candle, with its body fully covering the previous candle’s body. A Bullish Engulfing pattern occurs when a small red candle is followed by a large green candle, indicating potential upward momentum. A Bearish Engulfing pattern, on the other hand, occurs when a small green candle is followed by a large red candle, signalling a potential downward movement.
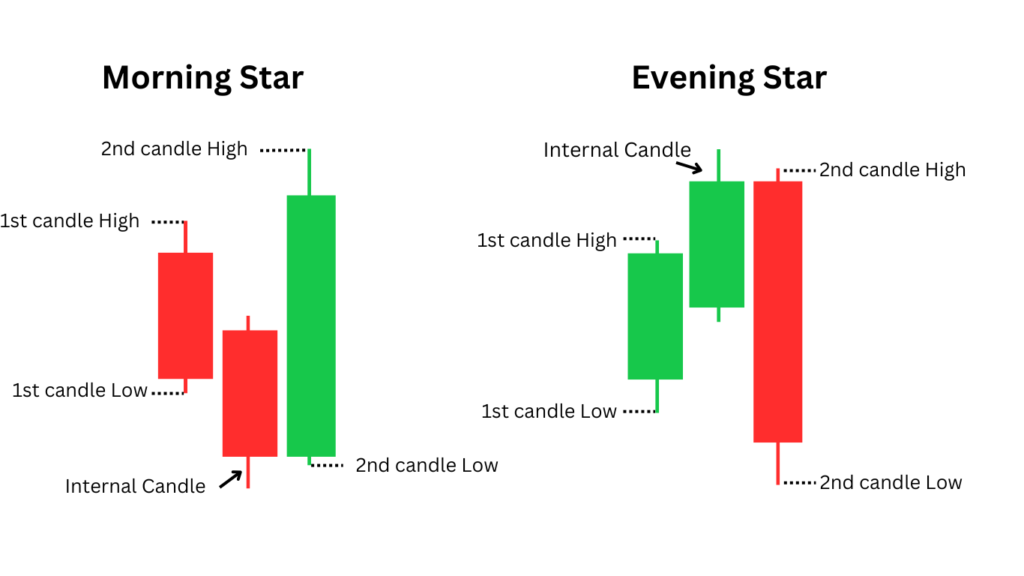
4. Morning Star and Evening Star
The Morning Star is a three-candle pattern that indicates a bullish reversal. It consists of a large red candle, followed by a small body (which can be a Doji), and then a large green candle. The Evening Star is the opposite of the Morning Star and signals a bearish reversal. It consists of a large green candle, followed by a small body, and then a large red candle.
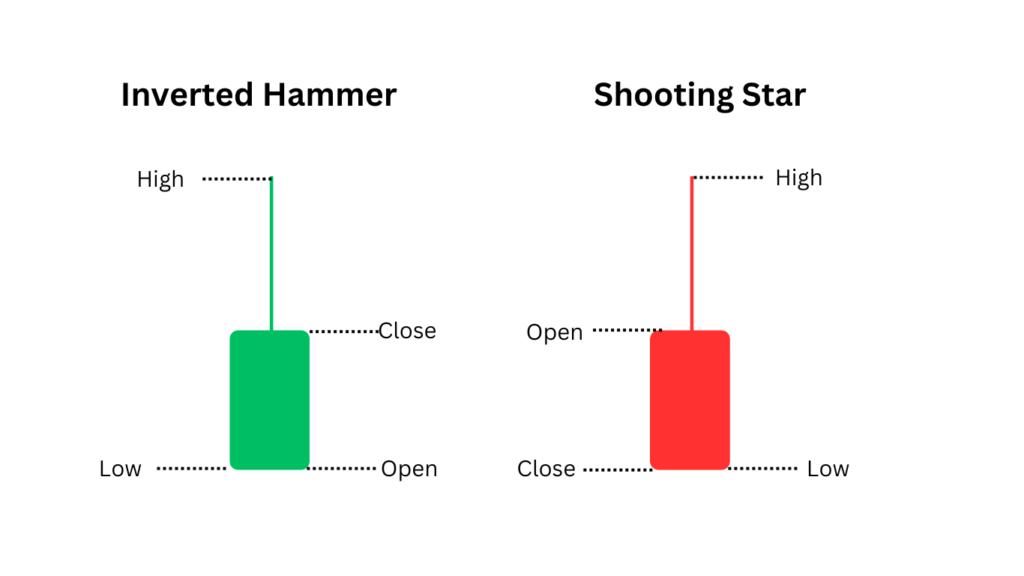
5. Shooting Star and Inverted Hammer
The Shooting Star and Inverted Hammer both have small bodies and long upper wicks. The Shooting Star appears after an uptrend and signals a bearish reversal, while the Inverted Hammer appears after a downtrend and suggests a bullish reversal. Both patterns indicate that there was a strong push in one direction but the market reversed, suggesting potential trend changes.
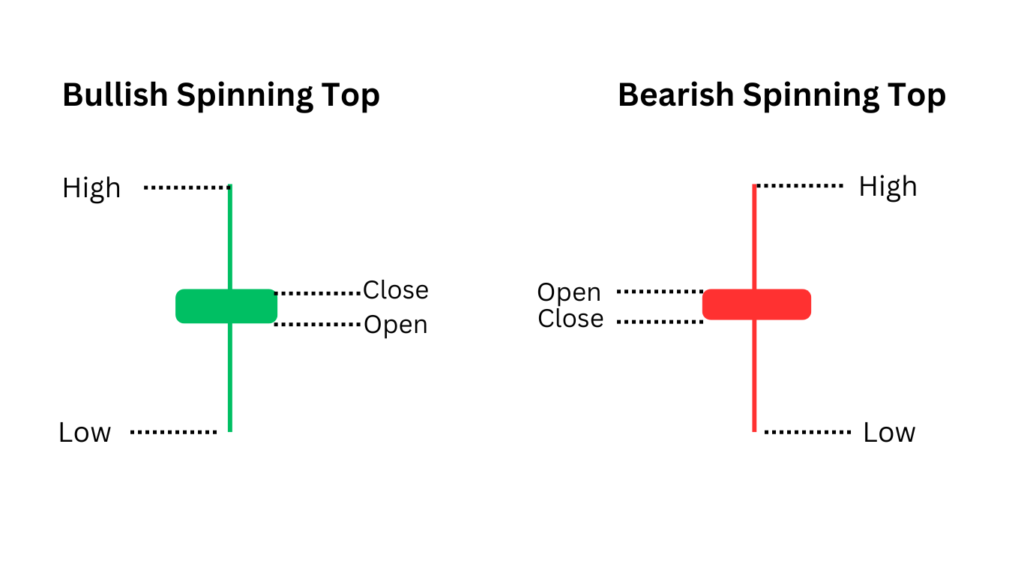
6. Spinning Top
A Spinning Top is a candlestick pattern with a small body and long wicks on both sides. It indicates indecision in the market. A Spinning Top suggests that neither buyers nor sellers were able to control the market, signalling a possible trend reversal or consolidation.
How to Use Candlestick Patterns for Trading
Candlestick patterns are powerful tools when used in conjunction with other forms of technical analysis. They can provide valuable insights into potential price movements, but they should not be relied on in isolation. To increase the accuracy of predictions, traders often combine candlestick patterns with other indicators like moving averages, RSI, and MACD.
Here are some tips for using candlestick patterns effectively:
- Confirm with Other Indicators: Always confirm candlestick patterns with other indicators. For example, a Bullish Engulfing pattern is stronger when it is supported by an upward trend in the RSI.
- Look for Patterns in Context: Candlestick patterns are more effective when they appear in the context of a trend. For example, a Hammer pattern at the bottom of a downtrend is more likely to signal a reversal than a Hammer in the middle of a range-bound market.
- Pay Attention to Volume: Volume can help confirm the strength of a candlestick pattern. Higher volume with a candlestick pattern suggests that the signal is stronger.
Benefits of Using Candlestick Patterns
Candlestick patterns offer several advantages for forex traders:
- Clear Visual Representation: Candlestick charts provide a clear and concise representation of price movements. They allow traders to quickly assess market conditions and spot potential reversals.
- Market Sentiment: Candlestick patterns give traders a direct view of market sentiment, helping them gauge whether buyers or sellers are in control.
- Versatility: Candlestick patterns can be used in any time frame, making them suitable for both short-term and long-term trading strategies.
Conclusion
Candlestick patterns are a crucial tool for forex traders. They provide insights into market sentiment and help traders predict future price movements. While it’s essential to understand the different types of patterns, it’s also important to use them in conjunction with other technical analysis tools to confirm signals. By mastering candlestick patterns, traders can enhance their decision-making and improve their chances of success in the forex market.
amazing content
Good
Most Valuable content.